Setting a new standard for data driven real estate experiences
Intelligence is the industry standard for measuring and assessing the health and performance of a customer’s experience within a property, which directly correlates to tenant and employee engagement, satisfaction, and retention.

Built for
The ultimate real estate experience analytics and insights tool
- Access global real estate insights from 1.7 million+ employees and 8,000+ workplaces collected through the proven methodology of Leesman, an HqO company and the industry’s most trusted workplace experience data source and benchmarking framework.
- Generate property-specific insights and benchmarking through the deployment of Intelligence at your own asset.
The Intelligence Product Suite
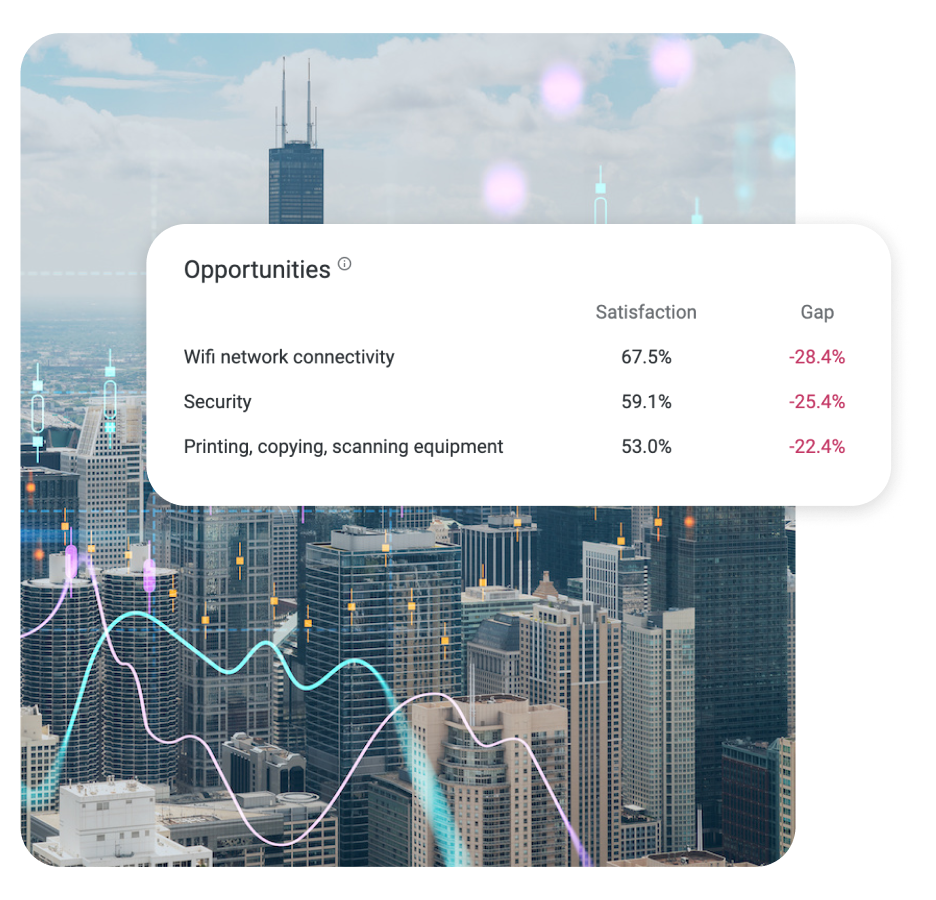
Intelligence delivers unparalleled analytics on workplace sentiment, trends, expectations gaps, and competitive insights that arm the world's most innovative and forward-thinking organizations.
")
REX Assessment
The REX Assessment is the industry-leading tool for quantifying employees’ workstyles, preferences and overall satisfaction. It requires only 10 minutes from end-users.
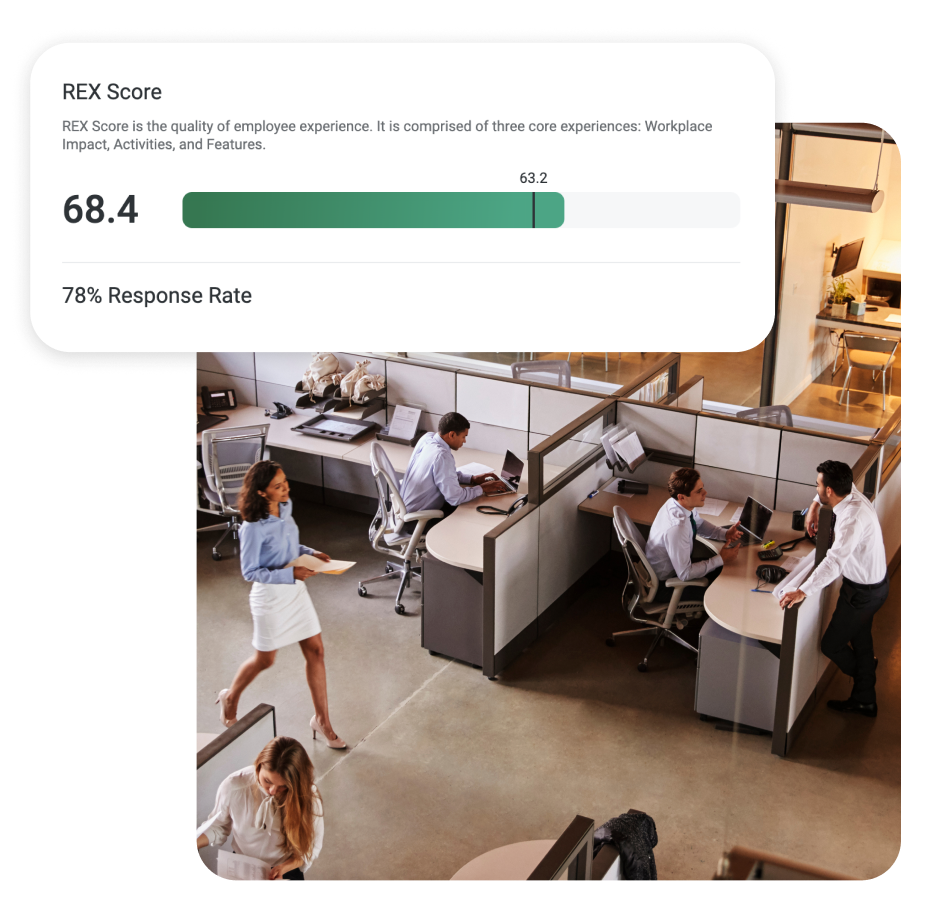
REX Score
The REX Score is the quality measure of end-user experience within a physical space, reflecting employees’ workstyles, preferences, and overall satisfaction. Generated through data from HqO’s REX Assessment, the Score shows how engaged tenants and employees are within a property. The higher the number, the more positive the real estate experience, which directly correlates to how likely a property is to achieve high occupancy, attract and retain tenants, and generate revenue.
REX Index
The REX Index (REXi) is the industry’s first global real estate user experience indicator, benchmark, and tool for certifying and exploring properties through the lens of people’s experiences.
Every REX Score will be added to and become part of the REXi, which allows customers to measure and compare their places of work against the best in the world.
The ultimate real estate experience analytics and insights tool
- Access global real estate insights from 1.7 million+ employees and 8,000+ workplaces collected through the proven methodology of Leesman, an HqO company and the industry’s most trusted workplace experience data source and benchmarking framework.
- Generate property-specific insights and benchmarking through the deployment of Intelligence at your own space.
The Intelligence Product Suite
Intelligence delivers unparalleled analytics on workplace sentiment, trends, expectations gaps, and competitive insights that arm the world's most innovative and forward-thinking organizations.
REX Assessment
The REX Assessment is the industry-leading tool for quantifying employees’ workstyles, preferences, and overall satisfaction. It requires only 10 minutes from end-users.
REX Score
The REX Score is the quality measure of end-user experience within a physical space, reflecting employees’ workstyles, preferences, and overall satisfaction. Generated through data from the REX Assessment, the Score shows how satisfied and engaged employees are within a physical space. The higher the number, the more positive the real estate experience within a property, which directly correlates to how likely an employer is to attract and retain employees, and meet their business goals.
REX Index
The REX Index (REXi) is the industry’s first global real estate user experience indicator, benchmark and tool for certifying and exploring properties through the lens of employee's experiences. Every REX Score will be added to and become part of the REXi, which allows employers to measure and compare their places of work against the best in the world.
Speak to an expert
Evaluate your real estate experience with one of our experts, and get access to data and insights that can help you elevate it!